Figure 4.

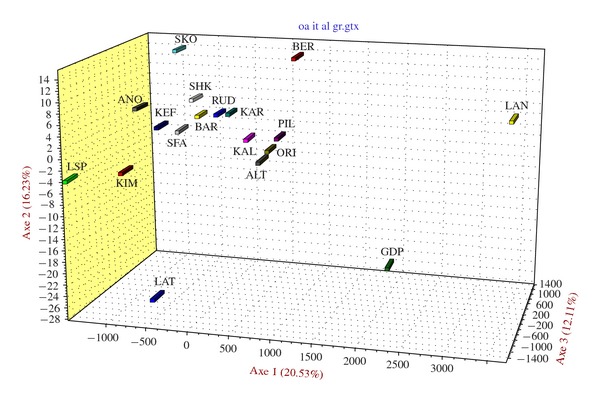
PCA analysis of the breeds assessed by SNP markers. The first three axes, cumulatively explaining 48.87% of the total inertia, were considered.

PCA analysis of the breeds assessed by SNP markers. The first three axes, cumulatively explaining 48.87% of the total inertia, were considered.