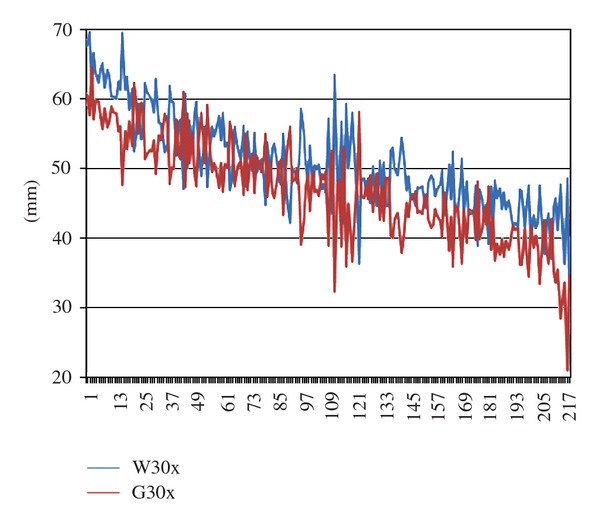
Figure 6.

Mean stalk length of G30x and W30x seedlings by dish pair in the autumn experiments (A1 through A9), with dish pairs ordered according to their joint mean stalk length. Red line: curve connecting G30x values; blue line: curve connecting W30x values; ordinate: mm; abscissa: dish pairs ordered according to their joint mean stalk length. For further explanations see text.
