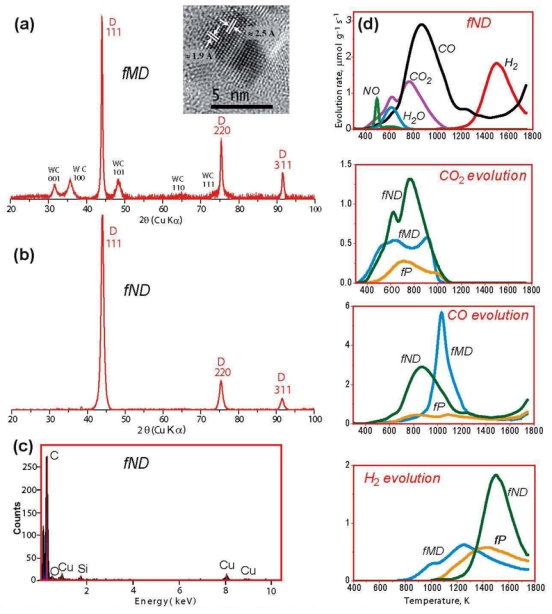
Figure 2.

Sample structure and composition of the fMD, fND and fP fractions from the production process. (a) XRD pattern of the fMD sample showing a severe contamination with hexagonal WC. The WC diffraction peaks (31.48°, (001), 35.76° (100), 48.40° (101), 64.04° (110), 65.32° (002), 73.20° (111), 75.60° (200), 76.92° (102)84.16° (201), according to JCPDS 25–1047) are indicated with (hkl) values. The inset is the HRTEM image of a WC nanocrystal. Arrows show lattice fringes of the WC {100} and {101} planes, (b) XRD pattern of the fND sample showing intense peaks indexed to the cubic diamond structure (43.97° (111), 75.37° (220), 91.59° (311); peak position and relative integrated intensities of each peak are within one standard deviation of the values given in JCPDS card no. 6–0675). (c) Energy-dispersive x-ray (EDX) spectrum of the purified nanodiamond (fND) samples. The spectrum shows that the tungsten has been efficiently removed. The carbon Kα line remains as the only relevant peak in the spectrum, reflecting the purity of the diamond crystals. (d) Thermal desorption profiles of CO2, CO and H2 for the fND fraction and of either CO2, CO or H2 for the fMD, fND and the centrifugation precipitate (fP) fractions.
