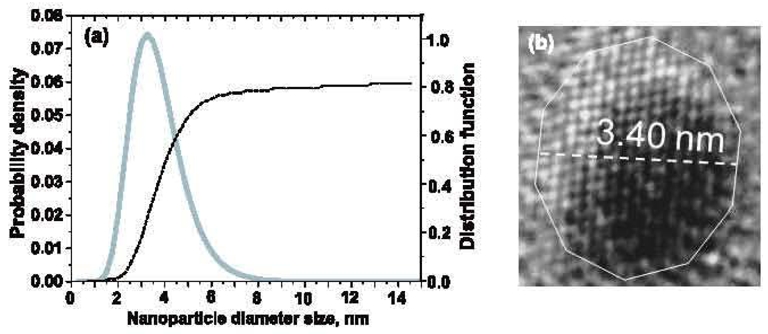
Figure 5.

(a) Lognormal distribution of nanodiamond and sizes from HRTEM images, (b) Example of polygonal slightly flattened contour placed over an HRTEM ellipsoidal nanodiamond image with its minor axis (broken line) taken as an approximation of the nanocrystal diameter. This measurement is calibrated both by the scale of observation and with the {111} interplanar spacing.
