
Figure 8.
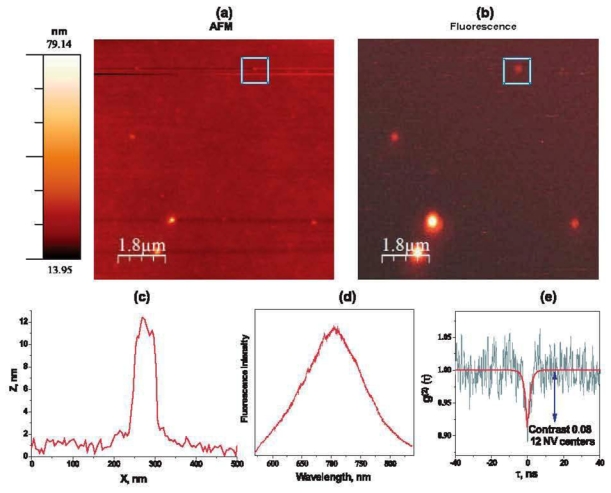
Atomic force microscopy (a) and photo luminescence microscopy (b) images of the fP + fND fraction obtained by milling of the fluorescent microdiamond (shown in figure 7(c)) and purification of the resulting fMD fraction, (c) AFM dimensions of a 10 nm bright fND diamond nanocrystal marked with a square frame in panels (a) and (b). (d) Photoluminescence spectrum of the same nanodiamond, corresponding to the NV center emission. (e) Second-order fluorescence autocorrelation function for the same nanodiamond. Note that the dip of photon counting statistics curve is related to 12 emitters in the nanocrystal. Analysis of contrast of such a dip allows us to count the number of fluorescing defects.