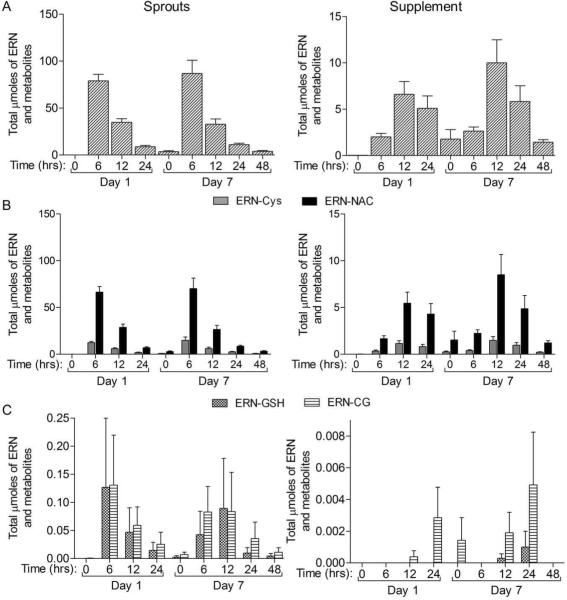
Figure 4. The μmoles of ERN metabolites excreted in the urine over the course of the study.
The time indicated is the time since last consumption of sprouts or supplement on either 1st or 7th day of consumption. Complete urine was collected from the previous time point to the time point indicated. A) All ERN compounds summed for each time block. B) The major metabolites in the urine, ERN-NAC and ERN-Cys. C) The minor metabolites in the urine, ERNCG and ERN-GSH. Data in bar graphs represent mean ± SEM (n=11).

