
Figure 6. Histone deacetylase (HDAC) activity in peripheral blood mononuclear cells (PBMC) following sprout or supplement consumption.
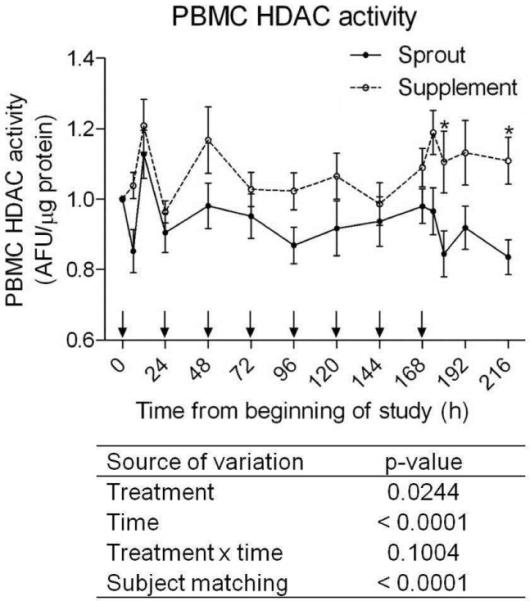
Each subject was normalized to their baseline HDAC activity (time zero). Solid circles and lines represent the sprout group and open circle and dotted lines represent the supplement group. Arrows along the x-axis indicate when sprouts or supplement were consumed. Each data point represent mean ± SEM (n=11). The data were analyzed by two-way ANOVA and p-values are shown below the graph.