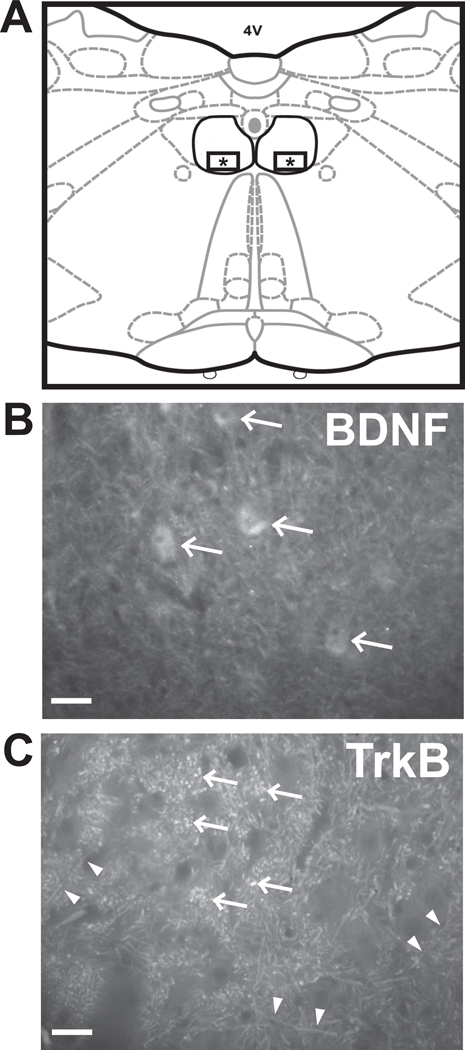
Fig 1.
(A) Diagram of a representative coronal section through the caudal medulla showing the location of images used for measurement of fluorescent signal for BDNF and TrkB. The hypoglossal nucleus is outlined in black. The squares containing asterisks within the ventral half of the nucleus depict the areas imaged. (B) Representative image of BDNF immunoreactivity showing diffuse staining throughout the nucleus. Staining was more intense in cell bodies (arrows). (C) Representative image of TrkB immunoreactivity showing punctuate staining of axons (double arrow heads) and synaptic boutons (arrows). Scale bar = 50 µm.

