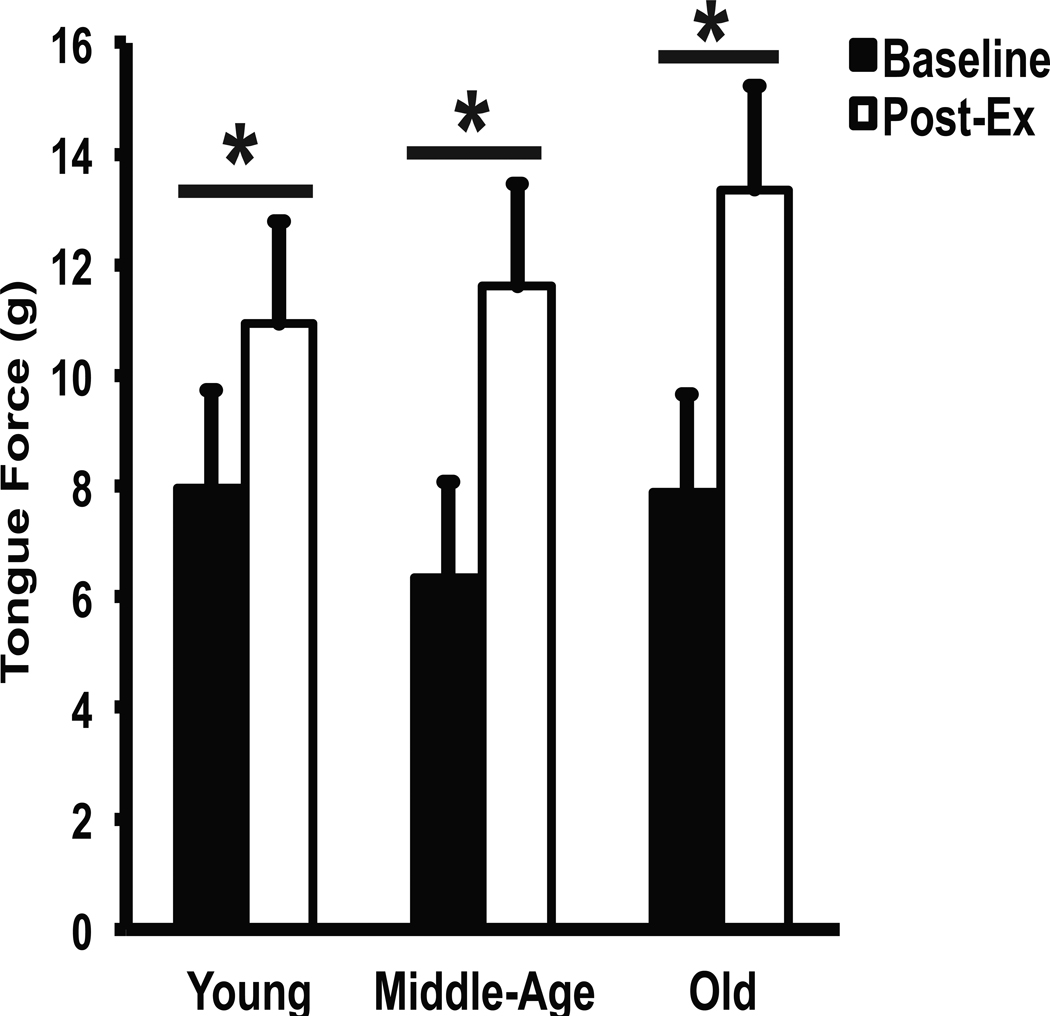
Fig 2.
Effect of tongue exercise on behavioral tongue forces at different ages. Age groups (young, middle-age, and old) are represented along the horizontal axis and tongue force (in grams) is represented along the vertical axis. Black bars represent baseline tongue forces and white bars represent tongue forces following 8-weeks of tongue exercise. A significant increase (p < 0.05) in tongue force was seen in all age groups. * denotes significant values; error bars represent standard error of the mean.

