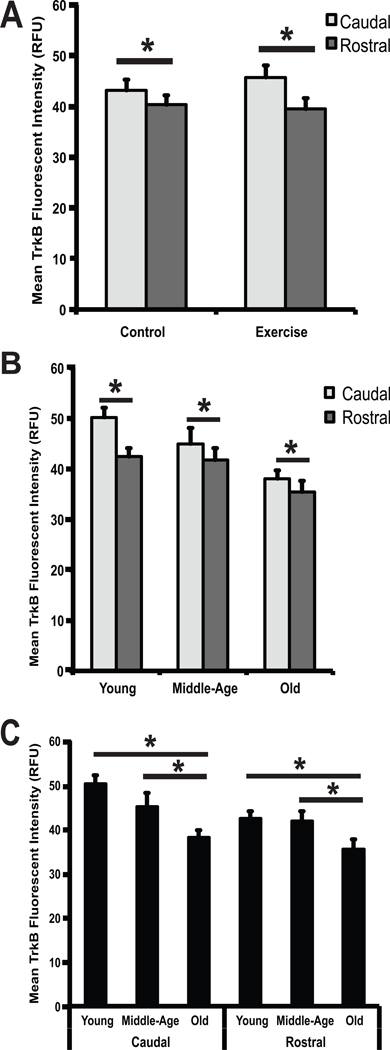
Fig 4.
(A–C) Changes in TrkB immunoreactivity by region (A), region and age (B) and age (C). (A) Mean TrkB fluorescent intensity, expressed in relative fluorescent units (RFU), is represented along the vertical axis. Control and exercise conditions are represented along the horizontal axis. TrkB immunoreactivity in the caudal portion of the hypoglossal nucleus is shown in light gray and TrkB immunoreactivity in the rostral portion of the hypoglossal nucleus is shown in dark gray. Significantly greater TrkB immunoreactivity (p < 0.05) was seen in the caudal portion of the hypoglossal nucleus compared to the rostral portion of the hypoglossal nucleus in both the control and exercise conditions. (B) Mean TrkB fluorescent intensity, expressed in relative fluorescent units (RFU) is represented along the vertical axis. Age groups (young, middle-age, and old) are represented along the horizontal axis. TrkB immunoreactivity in the caudal portion of the hypoglossal nucleus is shown in light gray and TrkB immunoreactivity in the rostral portion of the hypoglossal nucleus is shown in dark gray. Significantly greater TrkB immunoreactivity (p < 0.05) was seen in the caudal portion of the hypoglossal nucleus compared to the rostral portion of the hypoglossal nucleus in all age groups. (C) Mean TrkB fluorescent intensity, expressed in relative florescent units (RFU), is represented along the vertical axis. Age groups (young, middle-age, and old), divided into caudal and rostral regions, are represented along the horizontal axis. A significant decrease (p < 0.05) in TrkB immunoreactivity was seen in the old age group compared to the young and middle-age age groups in both the caudal and rostral portions of the hypoglossal nucleus. * denotes significant values; error bars represent standard error of the mean.

