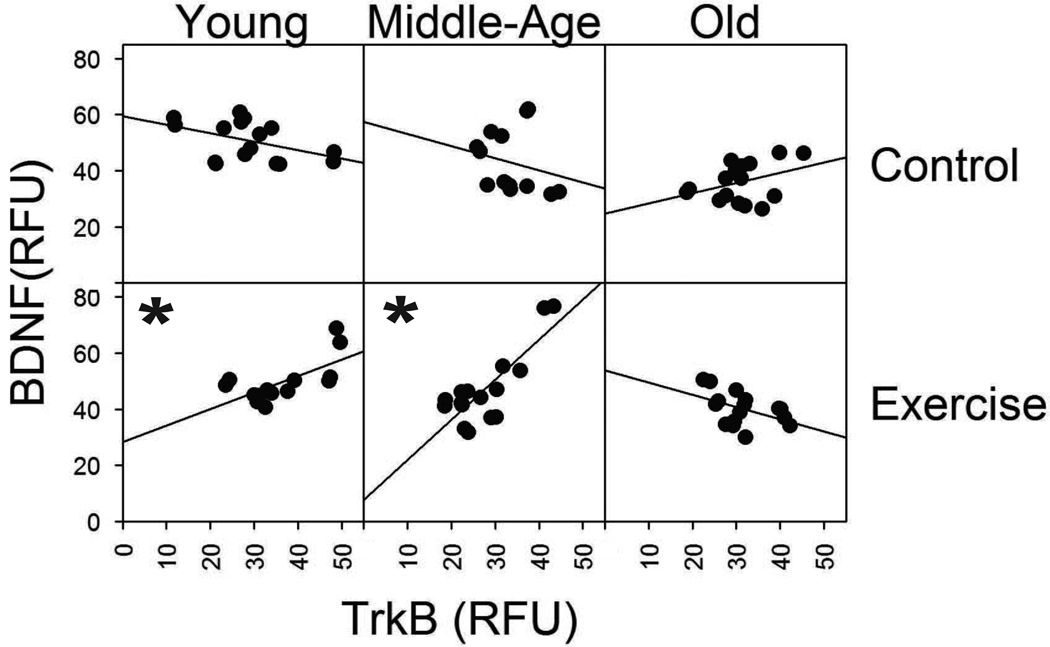
Fig 5.
Correlation between BDNF and TrkB immunoreactivity with exercise in young and in age groups. Each square represents a different age group and condition. The control condition is represented in the first row and the exercise condition represented in the second row. Age groups (young, middle-age, and old) are represented across the three columns, respectively. Within each square, mean TrkB intensity expressed in relative fluorescent units (RFU), is represented along the horizontal axis and mean BDNF intensity along the vertical axis. Each data point represents one animal. With both caudal and rostral data combined for each age group and condition. The slope of the line indicates the correlation between BDNF and TrkB immunoreactivity. A significant positive correlation (p < 0.05) between TrkB and BDNF was seen in the young and middle-age groups with exercise. * denotes significant values.

