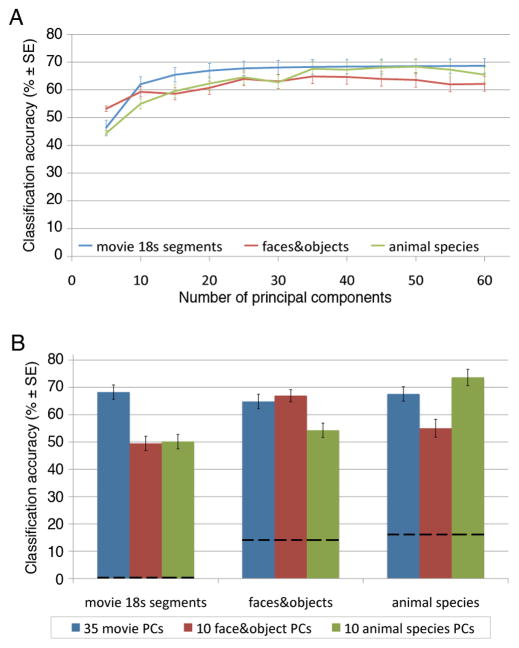
Figure 3.
BSC accuracies (means ± SE) after dimensionality reduction. A. BSC for 18 s movie time-segments, the face and object categories, and the animal species for different numbers of PCs. B. BSC for 35 PCs that were calculated based on responses during movie-viewing, on 10 PCs that were calculated based on responses to the face and object images, and on 10 PCs that were calculated based on responses to the animal images. Note that only the 35 PCs based on responses to the movie afforded high levels of BSC for stimuli from all three experiments. Dashed lines indicate chance performance. See also Supplementary Figure S3.

