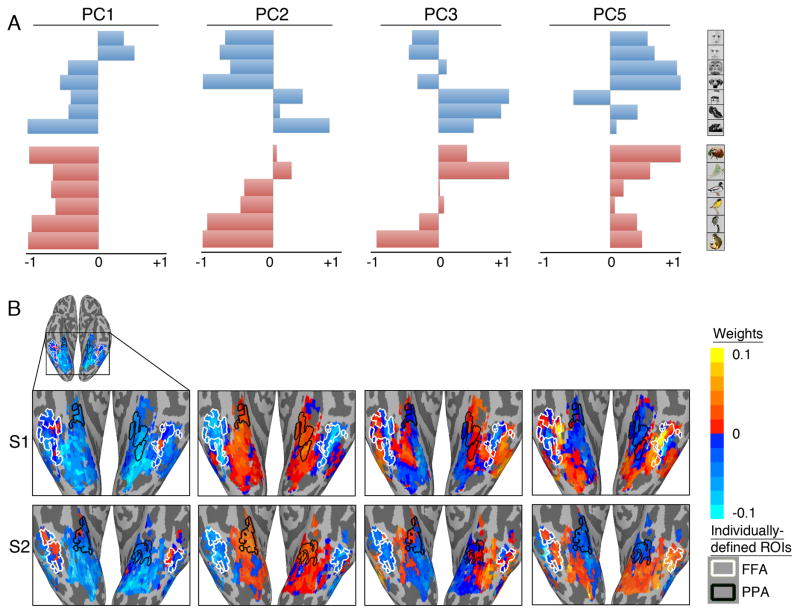
Figure 5.
A. Category response-tuning profiles for the 1st, 2nd, 3rd, and 5th PCs in the common model space. These PCs were derived to account for variance of responses to the movie, but they also are associated with differential responses to the categories in the other two experiments. The scale for response-tuning profiles is centered on zero, corresponding to the mean response to the movie, and scaled so that the maximum deviation from zero (positive or negative) is set to one. B. The cortical topographies for the same PCs projected into the native voxel spaces of two subjects as the voxel weights for each PC in the matrix of hyperalignment parameters for each subject. The outlines of individually-defined face-selective (FFA) and house-selective (PPA) regions are shown for reference. See also Supplementary Figure S5.

