
Fig 2.
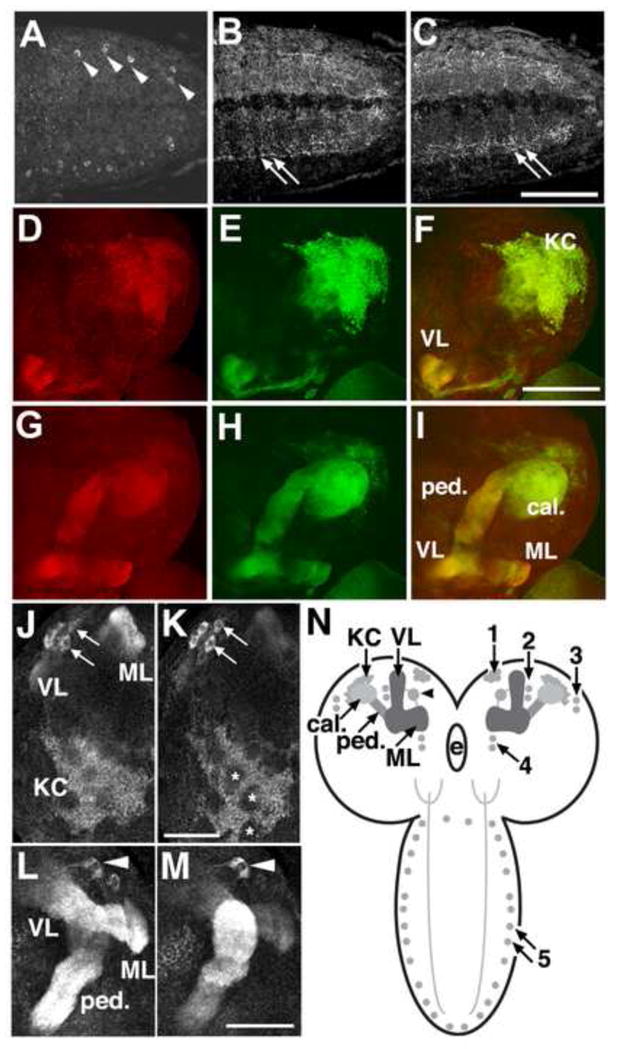
Localization of PRT in the larval ventral ganglion. A–C: One to two cell bodies per hemisegment express PRT and localize to lateral aspects of the ventral nerve cord. Processes project medially into the neuropil in a complex pattern that runs throughout the ventral ganglion. Confocal images show selected optical slices though the caudal aspect of the ventral ganglion to show the labeled cell bodies (A, arrowheads) and neuropil (B, C, arrows). Scale bar: 50 μm. D–I: PRT expression in larval mushroom bodies. Larval brains expressing the membrane bound form of GFP (mCD8-GFP) with the MB driver OK107-Gal4 were labeled for PRT followed by a Cy3 conjugated secondary antibody. Confocal images show a dorsalateral view of the brain (D–F) and more ventromedial sections (G–I). GFP expression (green), PRT labeling (red) and the merged images (F, I) are shown as horizontal sections with dorsal/posterior regions at the top of each image. We detect PRT in all aspects of the MBs, including the Kenyon cells (KC), calyx (ca), the penduncle (ped), and the vertical and medial lobes (VL and ML). Scale bar: 100 μm. J–M: Expression in larval Kenyon cells, a ventromedial cluster of cells, and a large extrinsic neuron. J, K) Two optical sections show expression of PRT in the Kenyon cells (KC) of the larval MBs. Patches of unlabeled areas in the center of the KC cluster are indicated (K, asterisks). A small portion of the medial lobes (ML) and vertical lobes (VL) are visible in J. An additional group of four to five cells (J, K, arrows) at the ventral-medial aspect of each optic lobe are also labeled. L, M) Two optical sections show a large extrinsic neuron (arrowhead) sending processes to both the medial (ML) and vertical lobes (VL). The peduncle of the MB is also indicated (ped). J–M show horizontal sections with the posterior side down. Scale bars: 50 μm. See also Fig S2. N) In the frontal perspective cartoon, the KC bodies are shown as light gray circles. Processes from these cells project ventrally and rostrally to form the peduncle (ped), then branch into medial (ML) and vertically (VL) projecting lobes in the central brain. The dendrites of the KCs form the calyx (ca). A relatively large, bilaterally symmetric extrinsic neuron expressing PRT projects into each ipsilateral MB. Additional cells expressing PRT in the brain and ventral ganglia are indicated as darker gray circles, and prominently labeled processes indicated with stippling. The numbers represent arbitrary designations of cell clusters in the larva. e=esophageal foramen.