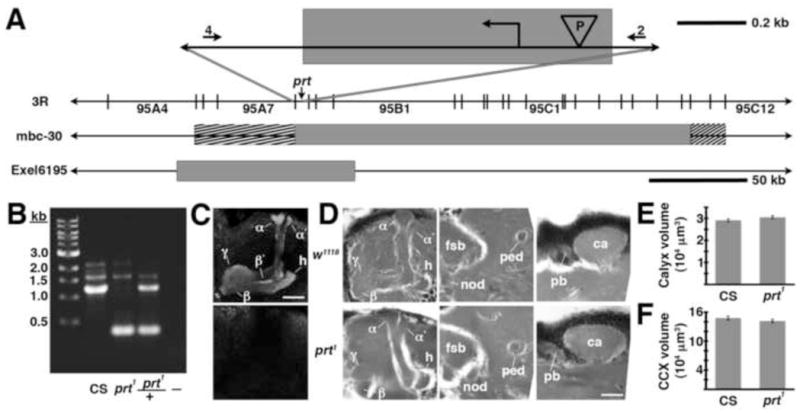
Fig 4.

The prt1 mutation. A) The relative position of the prt gene is shown in cytological region 95A8 on the 3rd chromosome. The shaded box at the top of the figure represents an approximately 850 bp deletion created with imprecise excision of a P-element (“P” in the inverted triangle), including the initiating methionine (
 ). The numbers 4 and 2 indicate primers used to detect the deletion. The lines below show deficiencies that uncover prt (Df(3R)mbc-30, Df(3R)Exel6195). The shaded boxes represent the deletion. The cross-hatched boxes indicate breakpoints approximated by polytene chromosome squash. Scale bars: 50 kb for deficiencies and 0.2 kb for inset. B) PCR was used to detect the prt1 mutation. Wild-type CS flies show a major band at 1.2 kb, prt1 flies show a major band at 400 bp, and prt1/+ heterozygotes show both. (−) indicates a no-template control. A 1 kb standard is shown on the left. C) Single confocal slices through the mushroom body lobes of whole-mount brains labeled with anti-PRT. A w1118 brain is on top with labeling of the MB lobes (α, α′, β, β′, and γ) and heel (h) and a prt1 brain is on bottom, showing no detectable anti-PRT labeling. Scale bar: 20 μm. D) H&E stained paraffin sections show that prt1 mutants have grossly intact MB morphology (α, α′, β, and γ lobes and heel (h), peduncle (ped), and calyx (ca)) and central complex (fan-shaped body (fsb), noduli (nod) and protocerebral bridge (pb)). The β′ lobe is also grossly intact in prt1 (not shown). Scale bar: 20 μm. E, F) Volumetric analyses of the MB calyx (E) and CCX (F) in CS and prt1 did not significantly differ (Student’s t-test, p = 0.1934 (E) and p = 0.2496 (F)). Bars represent means ± SEMs, n = 10 for all groups.
