
Fig 6.
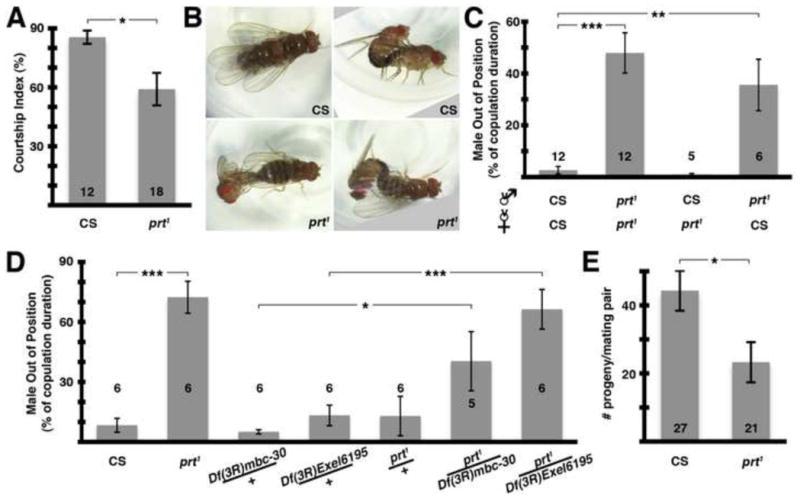
prt1 reproductive behavior. A) prt1 mutant males spent 26% less time courting (*, p = 0.0182). B) The top two panels show normal copulatory positions seen in wild-type flies while the bottom two panels show improper positioning exemplary of prt1. C) prt1 mutants struggle throughout copulation. Quantification of the time a male spends out of position during copulation revealed a significant difference between CS and prt1 (first two bars, p < 0.001). Inter-genotype pairings suggest the prt1 male was responsible for this phenotype (last two bars, p < 0.01). D) Two different deficiencies uncovered prt. Both prt1/Df(3R)mbc-30 and prt1/Df(3R)Exel6195 phenocopied the copulation behavior seen in prt1 (last two columns, p < 0.05 and 0.001, respectively). E) prt1 mutants were fertile but had reduced fecundity (# progeny/mating pair), 53% that of CS (*, p = 0.0167). * = p < 0.05, ** = p < 0.01, *** = p < 0.001. Statistical analyses included Student’s t-test for A & E and ANOVA with Bonferroni’s post test for multiple comparisons for all other assays. Bars represent means ± SEMs. The n for each group is shown with each column. See also Movies S1 and S2, and Fig S3.