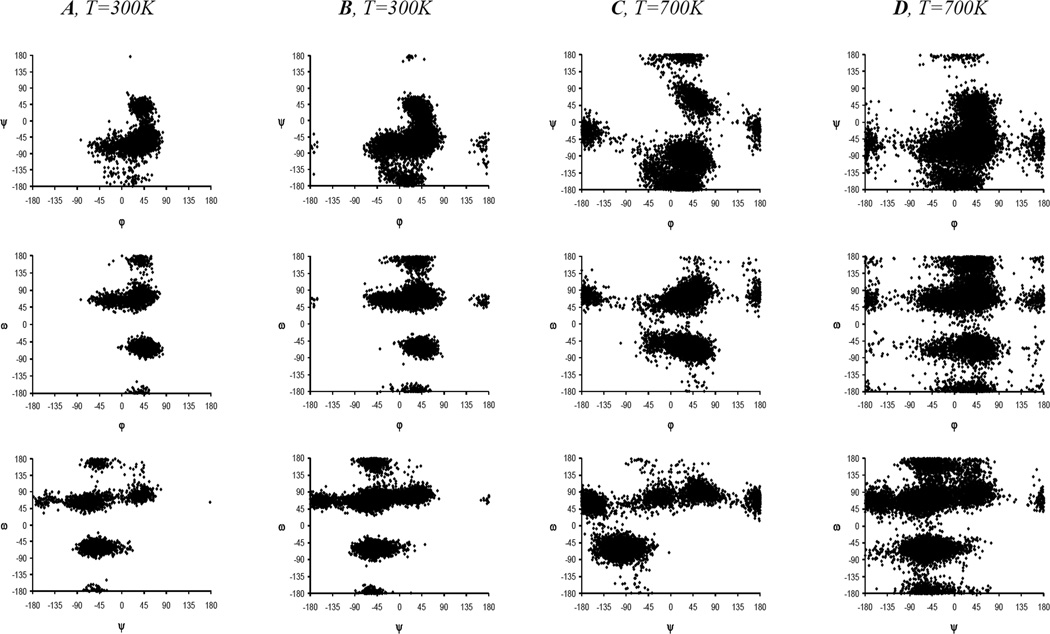
Figure 4.
Scatter plots for pairs of angles (φ, ψR), (φ, ω) and (ψR, ω) for internal disaccharide fragments of linear trisaccharide 2b (A) and heptasaccharide 6b (B) and their cyclic analogs 8b (C) and 12b (D). These scatter plots were built up with the use of SASA MD-simulation data at the temperature T=300 K for linear molecules 2b and 6b and T=700 K for cycles 8b and 12b.

