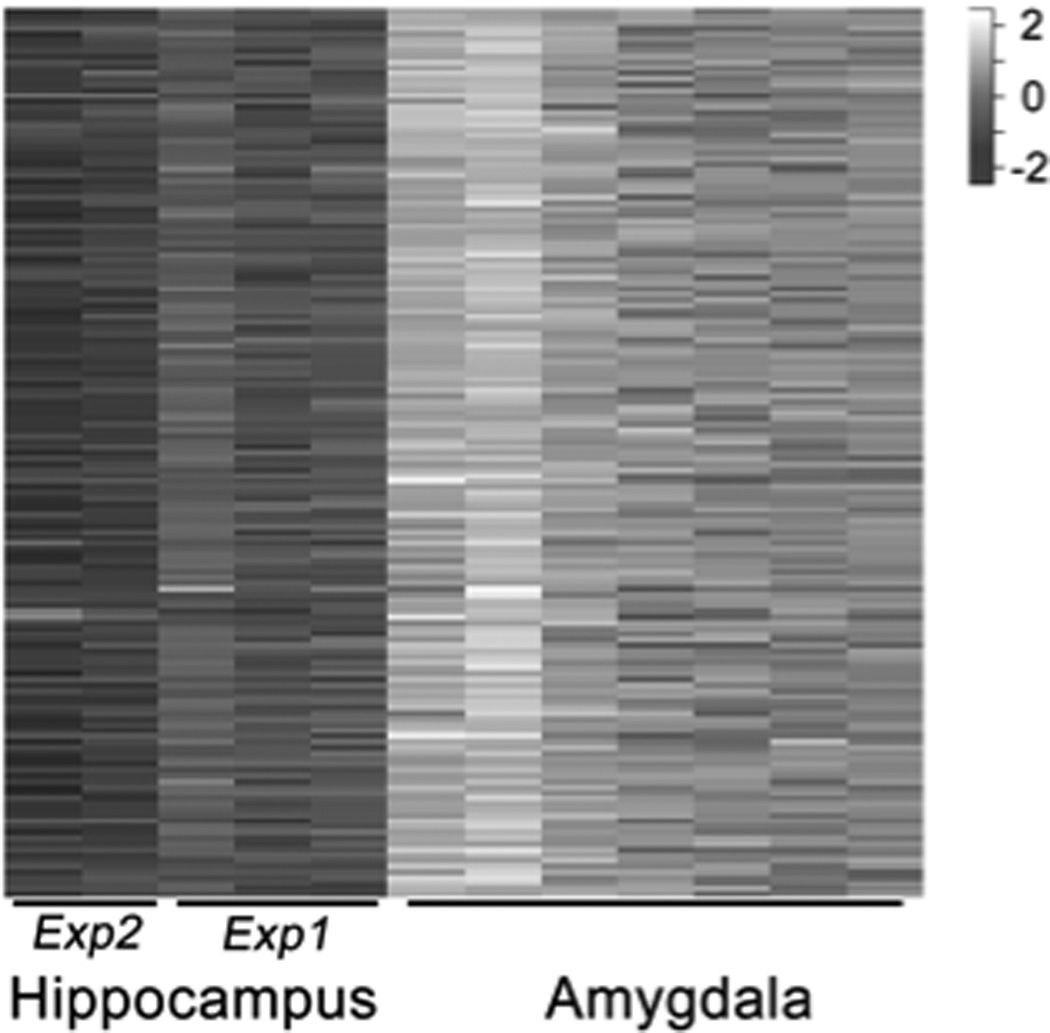
Figure 1. Heatmap of a representative bicluster that shows coherent change across samples.

Samples from two studies on the hippocampus show lower gene expression when compared to samples from amygdala. Within each tissue type, coherent changes in expression are also apparent.
