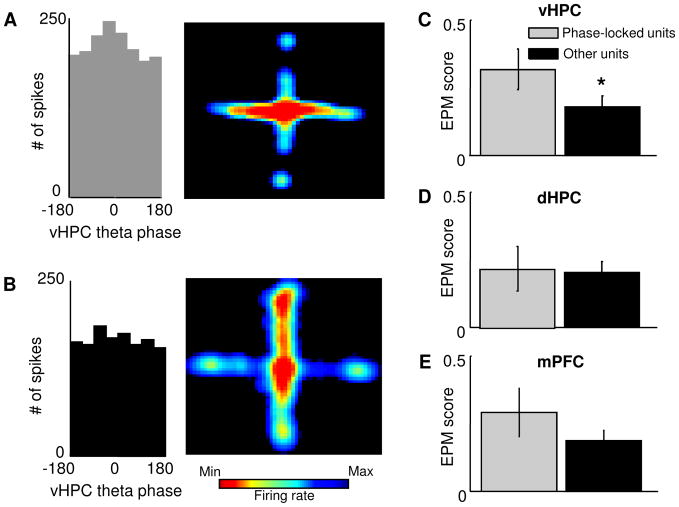
Figure 8. mPFC units phase-locked to vHPC theta oscillations have stronger task-related firing.
(A,B) Left Panel: Distribution of the phases of firing relative to vHPC theta oscillations for an example mPFC single unit. This unit is significantly phase-locked to vHPC theta oscillations (p<0.05, Rayleigh’s test for circular uniformity). Right panel: Spatial firing rate map for the same unit. Note that this unit is preferentially active in the open arms. (B) Same as (A), but for a unit that is not significantly phase-locked to vHPC theta (left panel) and that does not distinguish robustly closed arms from open arms (right panel). (C) Left panel: bar graph showing mean EPM scores for units that were (black bars) and were not (grey bars) significantly phase-locked to vHPC theta oscillations. Phase locked units had on average higher EPM scores than other units (mean score = 0.31 ± 0.07 and 0.17 ± 0.04, for phase locked and other units, respectively, p<0.05, Wilcoxon’s test, n = 69 units) Right panel: normalized cumulative sum distributions of the EPM scores shown averaged in the left panel. Note that the difference seen in the left panel between the EPM score distributions of vHPC phase locked units and other units is not due to a change in the size of the right tail of the distribution. (D) and (E) Same as (C), but for phase locking to dHPC and mPFC theta oscillations. Phase-locking to dHPC or mPFC theta oscillations did not have significant effects on EPM scores (p = 0.31 and 0.07, respectively). See also Figure S2.

