
Figure 9. mPFC units that follow vHPC theta oscillations have more robust task-related firing patterns.
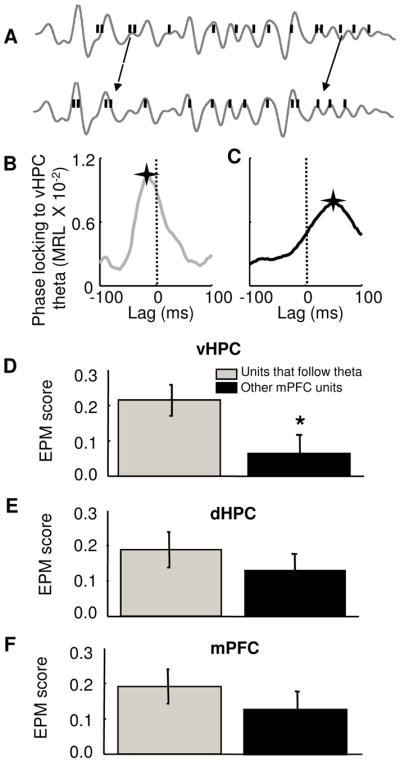
(A) Shifting the spike train (black bars) backwards in time (lower panel) relative to the theta-filtered vHPC local field potential (grey lines) reveals stronger phase-locking. (B) and (C) Effect of shifting the spike train of two representative mPFC single units on the strength of phase-locking (MRL) to vHPC theta oscillations. The unit in (B) follows vHPC theta, as the maximal MRL value is observed at a negative lag (−12 ms), while the unit in (C) leads vHPC theta, with a peak at a positive lag (+54 ms). A star marks the position of the maximum MRL. A dashed line was plotted at zero lag for reference. (D) Left panel: bar graph showing mean +/− EPM scores for units with negative lags relative to hippocampal theta (grey) and all other units (black). Units that followed vHPC theta had significantly higher EPM scores (mean score = 0.24 ± 0.047 and 0.07 ± 0.05 for units that follow vHPC theta and other units, respectively. *p<0.05, Wilcoxon’s test, n = 69 units). Right panel: normalized cumulative sum distributions of the EPM scores shown averaged in the left panel. (E) and (F) Same as (D), but for dHPC and mPFC theta oscillations. Units that followed mPFC or dHPC theta oscillations did not have higher EPM scores than other units, p=0.08 and 0.51, respectively).