
Figure 3. Distribution and phenotypes of Treg cells in secondary lymphoid organs of humanized mice.
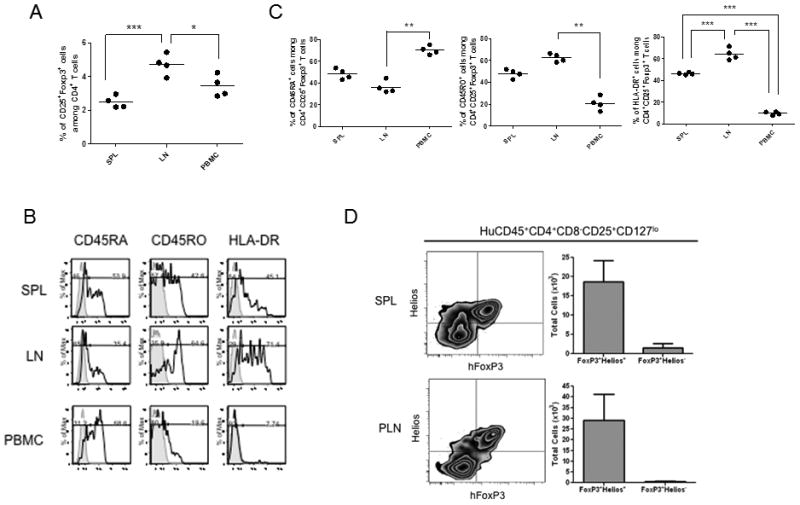
Humanized mice were sacrificed 21 weeks post-transplantation and mononuclear cells of spleen, LNs, thymic grafts and blood isolated from each individual mouse were analyzed by FCM. Mononuclear cells from each organ were isolated by ficoll separation and analyzed by FCM as in Figure 3. (A) Comparison of proportion of CD25+FoxP3+ regulatory T cells among CD4+ T cells in indicated organs. Each circle represents cells from an individual animal or donor. (B) Phenotypic characteristics of CD4+CD25+FoxP3+ regulatory T cells in indicated organs from representative humanized mouse. Histograms show expression of each indicated molecule. The bold line represents staining with fluorochrome-labelled mAb for the indicated molecule, and the filled area represents staining with isotype control mAb. (C) Comparison of phenotypic distribution of regulatory T cells among CD4+CD25+FoxP3+ cells. Each circle represents a result from an individual animal. * p < 0.05, ** p < 0.01, *** p < 0.001, comparing indicated combination (Kruskal Wallis test, Dunn’s multiple comparison test). (D) Natural Tregs were assessed in splenic (SPL) and peripheral lymph node (PLN) populations by flow cytometry, gating on human CD45+CD4+CD8−CD25+CD127lo and analyzing FoxP3+ cells for expression of Helios as shown (right panels). Total cells are calculated in FoxP3+Helios+ and FoxP3+Helios− cells from n=4 humanized mice.