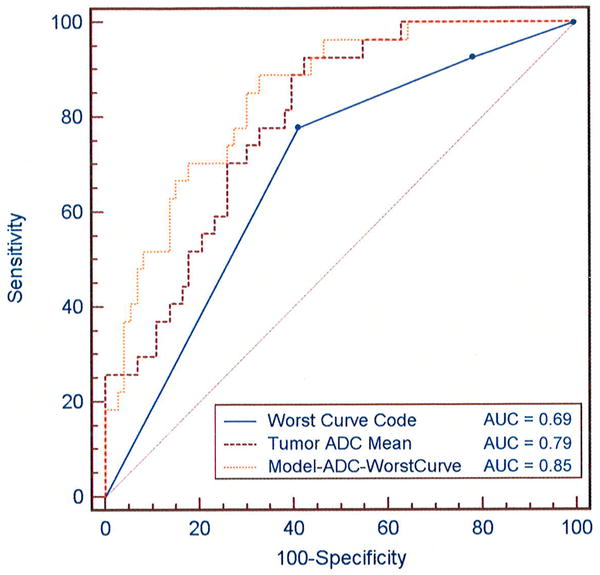
Figure 6.

ROC comparisons of ADC, DCE-MRI worst curve, and a model combining the two parameters for discriminating benign and malignant lesions. Curves represent the diagnostic performance of logistic regression models for (1) worst curve alone: y = 1.16 + 0.81*worst curve, where worst curve has value 1 for washout or 0 for no washout (persistent or plateau), (2) ADC alone: y = -4.36 + 3.63*ADC, where ADC is in units ×10-3 mm2/s, and (3) Combined ADC and worst curve: y = -4.28 + 3.69*ADC +0.84*worst curve. The area under the curve (AUC) is calculated for each model for comparison of diagnostic performance.
