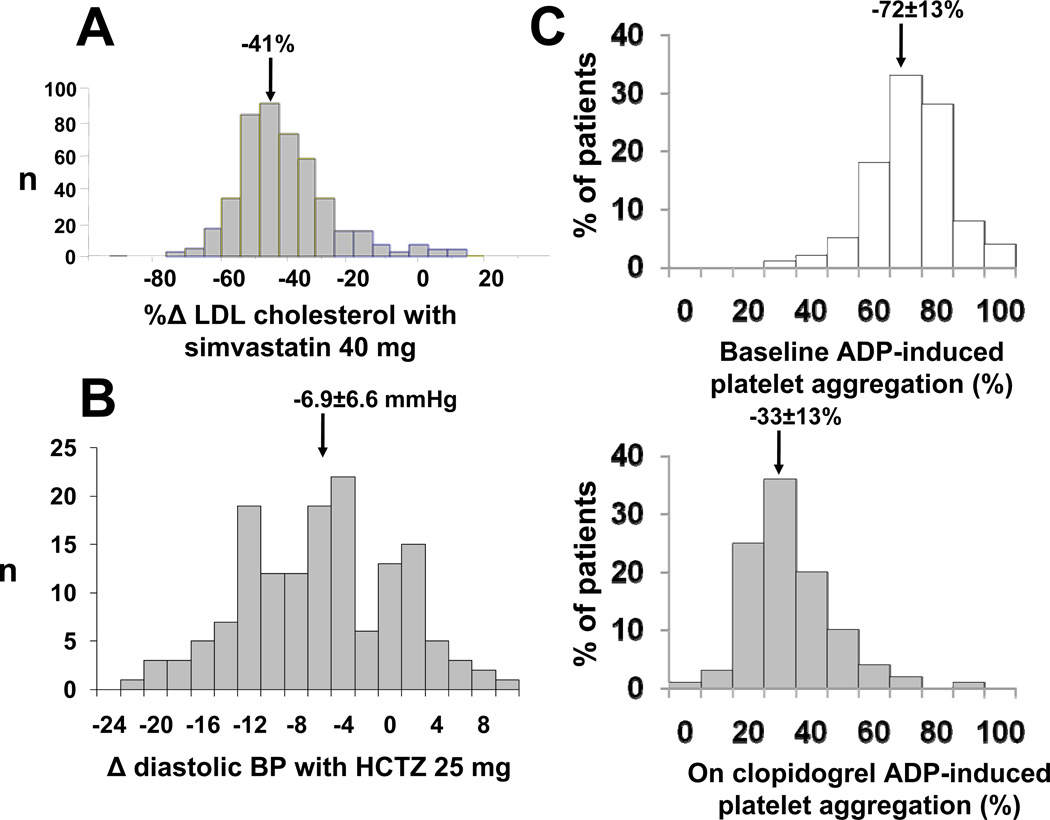
Figure 1. Variability in response to cardiovascular therapies.
A. Variability in LDL cholesterol lowering in response to simvastatin 40 mg/day for 6 weeks. The drug is highly effective, judged by mean response, but there is substantial variability with some subjects displaying no response and others LDL cholesterol lowering of up to 80%. Adapted by permission from Simon et al.156 B. Variability in decrease in diastolic blood pressure in response to hydrochlorothiazide (HCTZ) in 147 African-American subjects. As in panel A, the drug is effective, judged by mean response, but there is substantial variability. C. The top panel shows variability in ADP-induced platelet aggregation at baseline, and the bottom panel after clopidogrel. As in the other examples, there is a very obvious drug effect, but substantial variability across the population. Adapted by permission from Shuldiner et al.9

