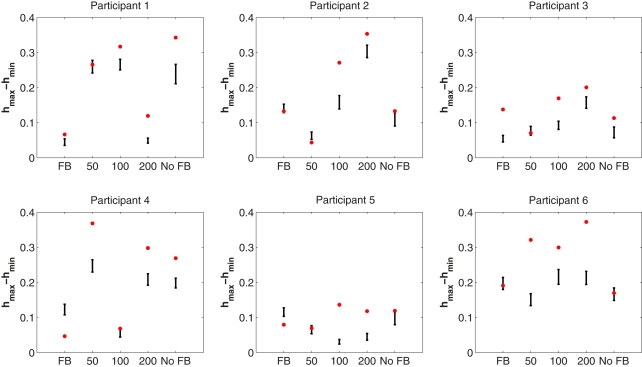
Figure 5.
Results from the multifractal analysis of ITI response series for each participant and each condition. The width of the multifractal spectrum width (hmax − hmin) is shown by a red dot. Ninety-five percentage confidence interval for the 30 surrogate time series from each response series is illustrated. Multifractal spectrum width for a pure simulated 1/f noise without phase couplings is close to zero.

