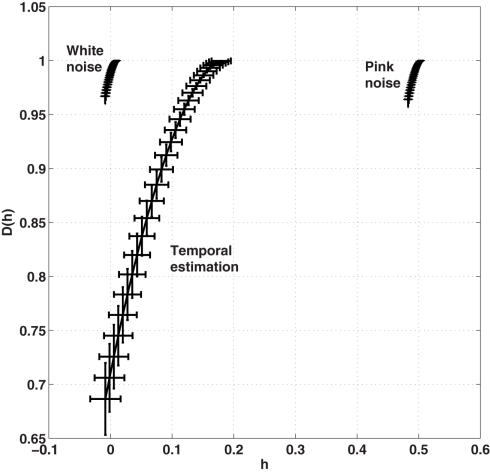
Figure 6.
Average multifractal width of the ITIs averaged across all participants and all conditions is presented in Figure 5. Results of the multifractal analysis of the simulated 1/f noises (α = 0; white noise and α = 1; pink noise) are provided for a comparison with the multifractal width of the observed time series of ITIs. Horizontal and vertical error bars indicate SE across 30 experimental response series and 30 simulations of each noise process, respectively.

