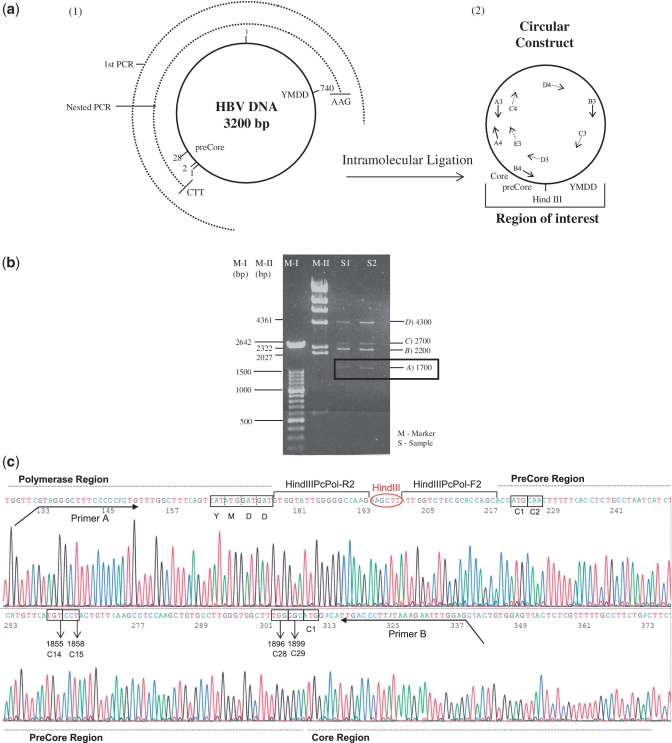
Figure 2.
(a) Schematic representation of the intramolecular ligation technique to obtain the preCore and YMDD Pol motif close to each other. (1) The circle in a continuous line represents the complete HBV genome (3200 bp). The semicircles in discontinuous lines represent the first (first PCR, 2700 bp) and the nested (2194 bp for genotype A2 sequences and 2155 bp for genotype D sequences) PCR products. (2) The product obtained after intramolecular ligation and primers used to sequence the circular molecule (Table 2) are indicated in the figure. (b) Agarose gel obtained after intramolecular digestion. Two markers (M-I and M-II) were loaded in the gel; band lengths are shown at the left side of the image. Two samples (S1 and S2) were loaded and four bands were detected; band lengths are indicated at the right side of the image. A band with an apparent size of 1700 bp was the circular molecule, with the preCore and YMDD Pol motif close to each other. Band B was the nested PCR product without ligation, and band D were dimers of nested PCR products without ligation. Band C corresponded to the ligated dimers. B, C and D bands were not used, because the main interest was to analyze regions from the same genome. (c) Sequence of the circular construct including the preCore region, YMDD polymerase motif (in box), and HindIII sequence. PreCore (1, 2, 14, 15, 28 and 29) and Core (1) codons analyzed in the text are also enclosed in boxes.

