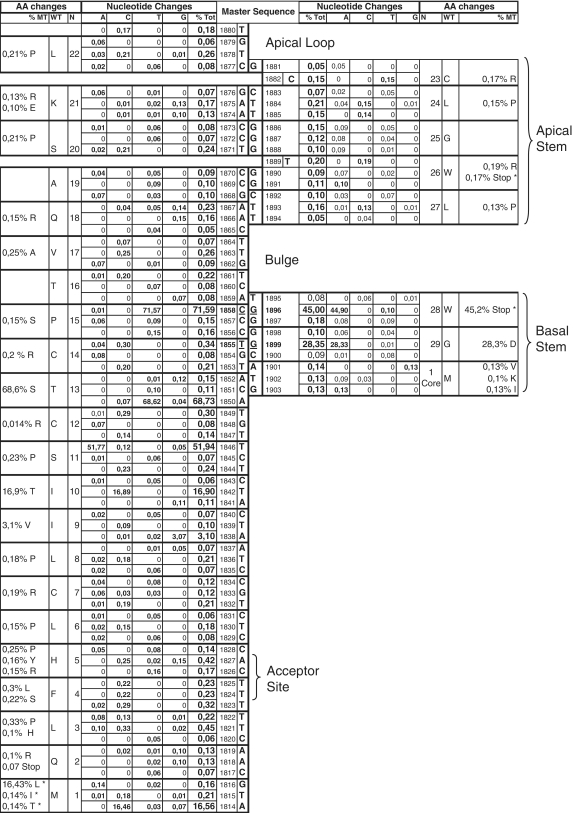
Figure 3.
Schematic representation of base pairing between the preCore positions analyzed, which correspond to the stem–loop structure. The columns in the center indicate the consensus sequence obtained from the laboratory’s entire collection of genotypes A sequences (bold characters). The ‘Nucleotide changes’ column indicates the percentage of each nucleotide change (%A, %C, %T and %C) and the total changes (%Tot) for all positions, attending to the master sequence. The ‘Amino acid (AA) changes’ column indicates the codon representing the position (N), the amino acid coded from the master sequence (WT), and the percentage of sequences that code for a different amino acid (%MT).

