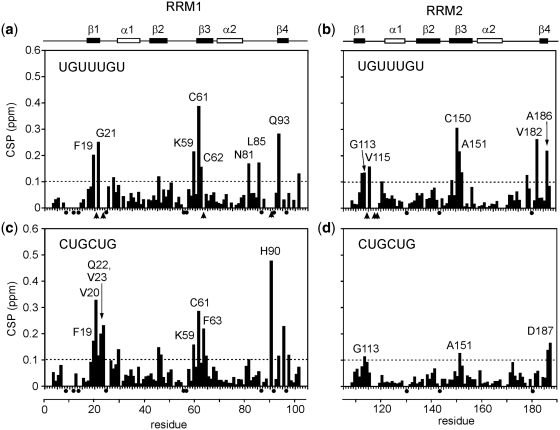
Figure 5.
NMR CSP plots for the binding of EDEN 7 (UGUUUGU) and CUGCUG to the two isolated RRMs. In (a) and (b), EDEN7 binding to RRM1 is illustrated, and in (c) and (d), binding of CUGCUG to RRM1 and RRM2. In each case an arbitrary cut-off of 0.1 ppm is shown by the dotted line with residues showing CSPs > 0.1 ppm individually labelled. In addition, proline residues are marked with a black dot and residues which broaden and disappear during the titration are marked with an arrow head. Along the top of the figure the relative position of the protein secondary structure is indicated.

