Figure 1.
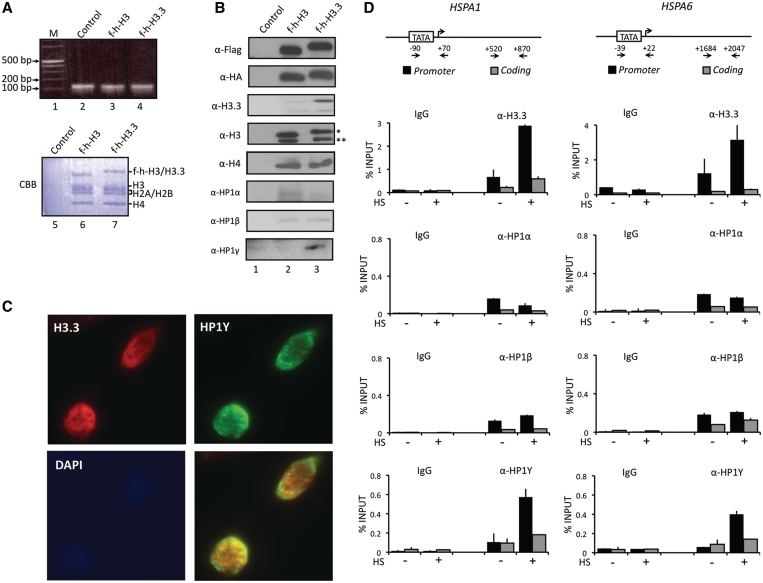
Selective interaction of HP1γ with H3.3 nucleosomes. (A) HeLa cells were transfected with control (lane 2), histone H3 (lane 3) and H3.3 (lane 4) expression vectors for 48 h, and mononucleosomes were prepared as summarized in Supplementary Figure S1A. Total nucleosomal DNA was subjected to 2% agarose gel electrophoresis and visualized with ethidium bromide (lanes 2–4). Mononucleosomes containing H3 or H3.3 were purified by sequential immunoprecipitations using anti-Flag and anti-HA antibodies, and histone compositions of the purified nucleosomes were analyzed by Coomassie staining following 15% SDS–PAGE (lanes 6 and 7). Lane 1, 0.1–12 kb DNA ladder; lane 5, control mock-purified material. (B) Proteins co-purified with H3 and H3.3 nucleosomes were separated by 15% SDS–PAGE, and the presence of indicated proteins were analyzed by Western blotting. Lane 1, mock-purified material; lane 2, H3 mononucleosomes; lane 3, H3.3 mononucleosomes. Asterisk indicates ectopic f-h-H3 or f-h-H3.3 proteins and double asterisks indicate endogenous H3 or H3.3 proteins. (C) HeLa cells were immunostained for HP1γ (green channel), H3.3 (red channel) and DAPI (blue channel). Image overlays show co-localization between HP1γ and H3.3. (D) HeLa cells were mock-treated (−) or heat-treated (+) for 30 min, and quantitative chromatin immunoprecipitation (ChIP) assays of promoter (filled square) and coding (shaded square) regions of HSPA1 and HSPA6 genes were performed using antibodies specifically recognizing H3.3, HP1α, HP1β and HP1γ. IgG antibody was used as a negative control. Input DNA and immunoprecipitated DNA were analyzed by qPCR analyses using primer sets depicted in the top panel. The results are shown as percentage of input. The error bar indicates the means ± SD.

