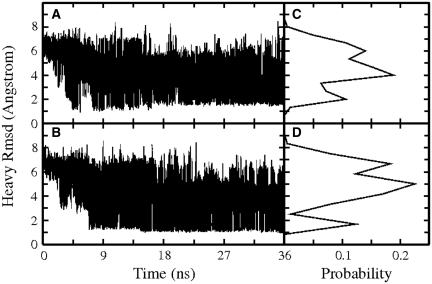
Figure 2.
RMSD (heavy atoms) of d(cgGCAcg) conformations (A) and d(gcGCAgc) conformations (B) sampled at the lowest temperature run of each REMD with respect to the corresponding folded hairpin reference structure (versus simulation time). The panels (C, D) on the right of each RMSD plot (A, B) correspond to the RMSD probability distributions during the whole 36 ns simulations (lowest temperature replica).

