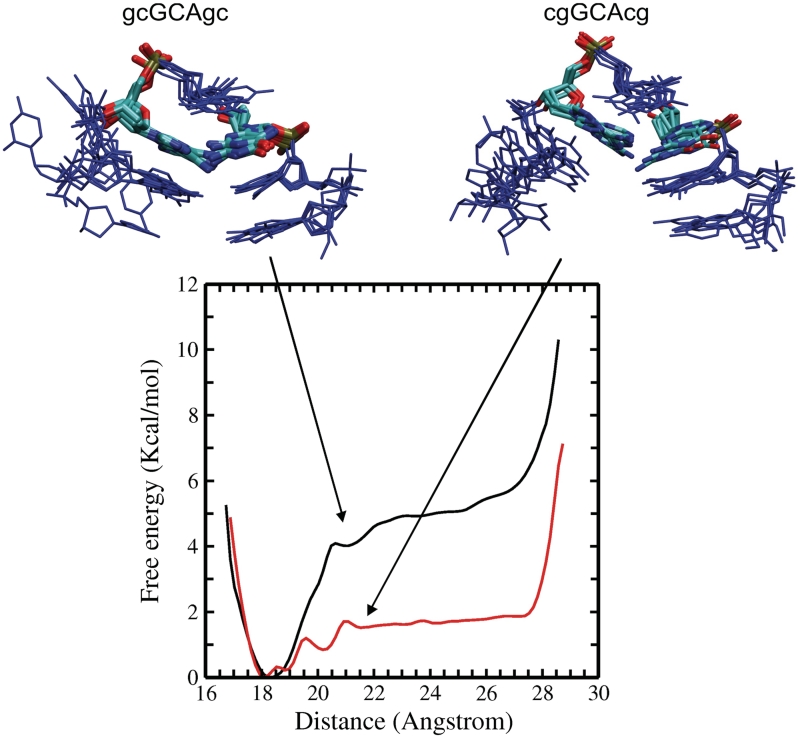
Figure 7.
Calculated free energy change (PMF) obtained from US simulations along the distance of the terminal phosphate groups starting from folded hairpin conformations. The upper panels show a superposition of sampled intermediate conformations [left panel: d(gcGCAgc) and right panel: d(cgGCAcg)] obtained from the US window at 20.5 Å phosphate–phosphate distance. Nucleotides are shown in blue except for G3 and A5 (atom color code). In case of the gcGCAgc sequence the sheared G3:A5 arrangement is frequently preserved, whereas in case of the cgGCAcg, it is largely replaced by a G3:A5 contact similar to the structure observed in the second most populated cluster from the REMD of the d(cgGCAcg) hairpin.

