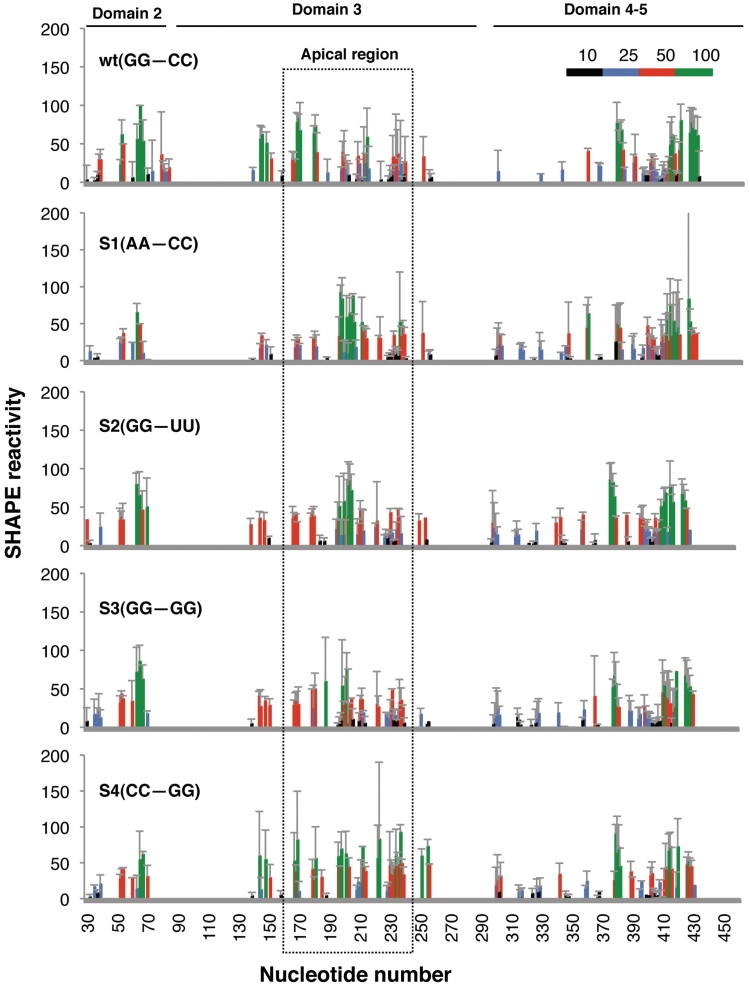
Figure 3.
SHAPE reactivity of apical stem IRES mutants. Values of SHAPE reactivity at each individual nucleotide position correspond to the mean reactivity (±SD) of three independent assays. RNAs, treated with NMIA or untreated, were subjected to primer extension analysis conducted with 5′-end labeled primers. The intensity of each band was normalized to the full-length cDNA product detected in the corresponding gel lane after subtraction of the corresponding background RT-stop signal in the untreated RNA. Nucleotide positions are indicated on the x-axis. The SHAPE reactivity is depicted using color-coded bars. Position of the apical region is indicated by a broken line rectangle.

