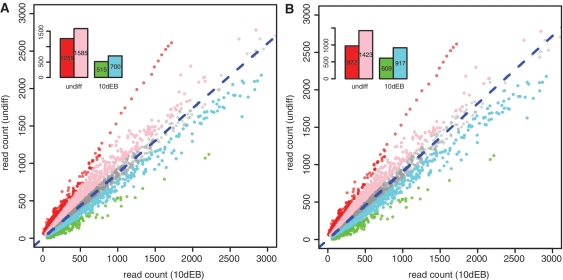
Figure 5.
Scatter plots of raw read counts of LF2-undiff and LF2-10dEB samples. (A) results based on ‘tagRatio’ method. (B) results based on ‘parsimony’ method. Genes in red and green are significant in both the tests of H3K27me3 enrichment between LF2-undiff and LF2-10dEB cells. Genes in pink and cyan are significant by the exact rate ratio test alone, but not significant by the z-test of log2ratio. Genes in gray are not significant by both tests. The bar plot on top left of each plot shows the number of genes in each category. The blue dotted line in each plot is the reference line of estimated read rate ratio.

