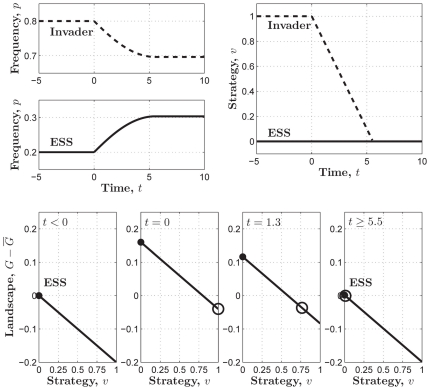
Figure 3. An invasion simulation of Darwinian dynamics of the linear PGG.
(Upper-left) Evolution of the frequencies of the ESS and the invader strategy starting from  and
and  respectively. (Upper-right) Evolution of the ESS and the invader strategy starting from
  and
and  and ending up with the latter evolving to the former. (Lower) Evolution of the adaptive landscape and the two strategies:
  (i.e., before the invasion happens),
  is the global maximum;
  (i.e., the invasion happens), the adaptive landscape is elevated with
  still being the global maximum and
  being the global minimum;
  , the invader strategy climbs up with the adaptive landscape going down;
  , the invader strategy coincides with
  and reaches the top of the adaptive landscape, which falls back to the state before the invasion happens. Parameters:
  ,
,  , and
, and  .
.

