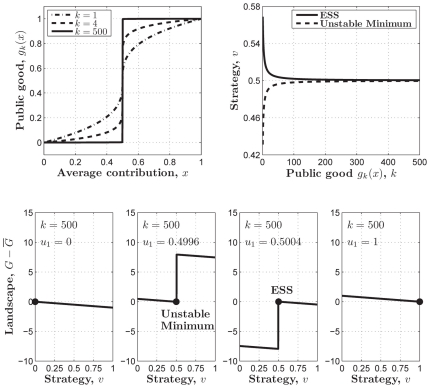
Figure 6. The approximate representative of the threshold PGG by a class of power functions.
(Upper-left)  where
where  ,
,  , and
, and  . (Upper-right) the ESS and the unstable minimum as the functions of parameter
  . They are getting closer and closer with increasing
  . (Lower) the adaptive landscapes when
  , and
, and  ,
,  ,
,  , and
, and  .
.  is an ESS which sits at the top of the adaptive landscape.
  is an unstable minimum at the bottom of the adaptive landscape. Parameters:
  , and
, and  .
.

