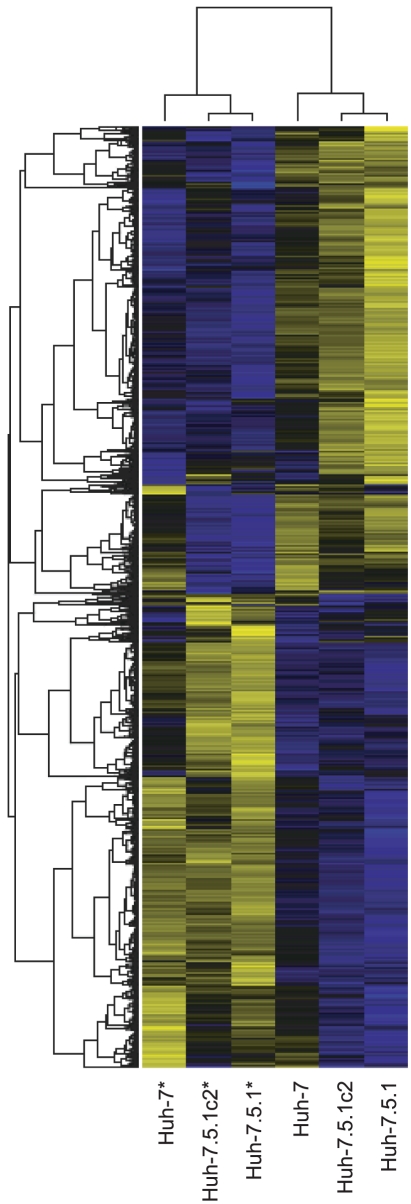
Figure 2. Hierarchical clustering plot displaying differentially expressed genes from infected and control cells.
Genes are represented by horizontal bands and cells by columns. Infected cells are denoted with an asterisk (*). Bands are coloured blue if the gene is downregulated and yellow if it is upregulated compared with the mean expression level for that gene. Greater colour intensity signifies greater fold change. Infected cells cluster with one another and gene clustering shows a clear pattern that corresponds to HCV infection-induced regulation of gene expression.

