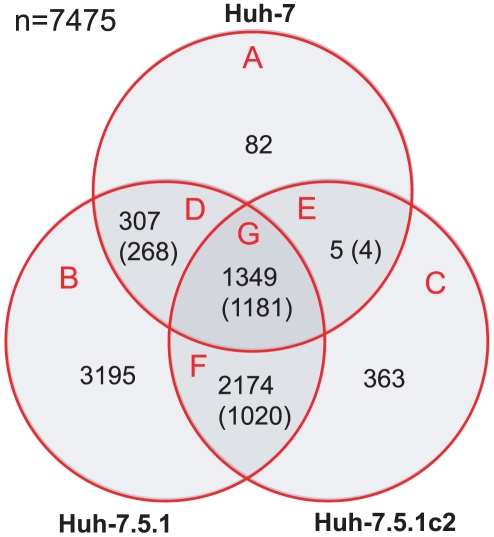
Figure 3. Venn diagram showing the overlap in genes differentially expressed due to HCV infection among susceptible cells.
The absolute numbers of significantly differentially expressed genes are given for Huh-7, Huh-7.5.1 and Huh-7.5.1c2 cells. The numbers in brackets refer to those genes that share the same direction of regulation (up- or downregulated) following infection, across multiple comparisons.

