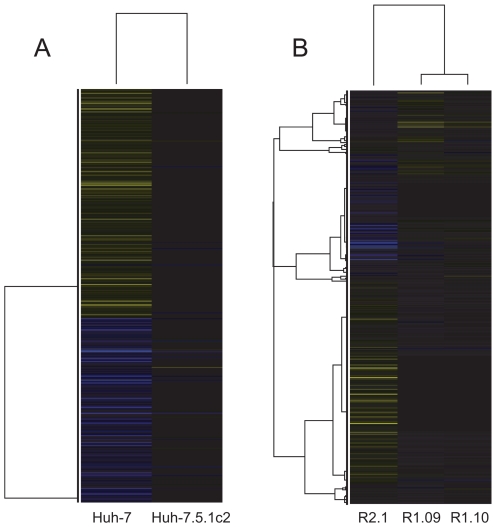
Figure 4. Hierarchical clustering plots showing the expression levels of differentially expressed genes between hepatoma cells.
Genes are represented by horizontal bands and cells by columns. Bands are coloured blue if the gene is downregulated and yellow if they are upregulated relative to their expression in Huh-7.5.1. Greater colour intensity relates to a greater fold change. Black bands represent genes whose expression is a similar level to Huh-7.5.1. (A) Comparison of gene expression levels between susceptible cells. Here, the Huh-7.5.1c2 cell line is clearly more similar in gene expression to Huh-7.5.1 than Huh-7. (B) Comparison of gene expression levels between resistant cells and Huh-7.5.1. The R2.1 cell line is more divergent from Huh-7.5.1 than either R.109 or R1.10 in terms of gene expression. R1.09 and R1.10 show similar patterns of gene expression.

