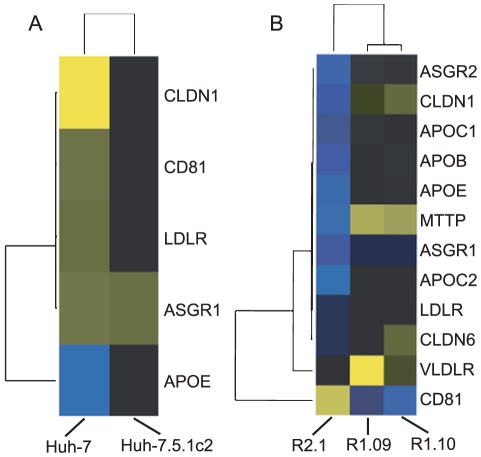
Figure 6. Hierarchical clustering plots showing the expression levels of differentially expressed HCV-linked cellular receptors and lipoproteins.
Genes are represented by horizontal bands and cells by columns. Bands are coloured blue if the gene is downregulated and yellow if they are upregulated, relative to their expression in Huh-7.5.1. Greater colour intensity relates to a greater fold change. Black bands represent genes whose expression is a similar level to Huh-7.5.1. (A) Comparison of gene expression levels between susceptible cells. All genes shown are linked to HCV cell entry except for MTTP and APOB that are associated with release of HCV from the cell. The majority of these host factors that undergo a significant change in expression are found at a higher level in Huh-7 than either of the Huh-7.5.1 derived cells. (B) Comparison of gene expression levels between resistant cells and Huh-7.5.1. R1.09 and R1.10 cells have have a lower level of expression of CD81 than Huh-7.5.1. Though R2.1 cells have a relatively high level of CD81 expression relative to Huh-7.5.1, other cell entry factors are expressed at lower levels.

