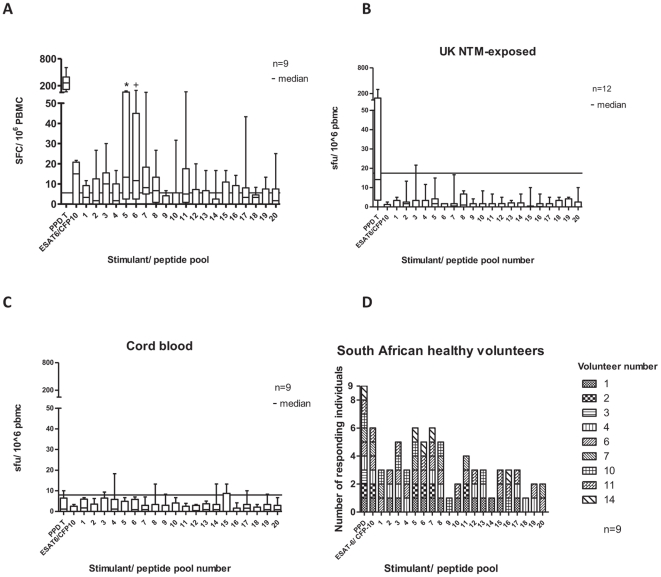
Figure 2. IFN-γ ex vivo ELISpot responses to pools of NTM-specific peptides.
IFN-γ ex vivo ELIspot assay comparing T cell responses in PBMC from healthy South Africans (A), NTM-exposed UK patients (B), UK cord blood samples (C) and number of responding South African healthy volunteers to each peptide pool (D). * P = 0.06, + P = 0.02, Wilcoxon matched pairs test, comparing peptide response with unstimulated cells. No other responses were statistically significantly different from unstimulated. Assay cut off = 3 median absolute deviations (MADs) above the median response to unstimulated PBMC. Median response (line), interquartile range (box) and range (whiskers) shown. Cut offs were 5 (A), 17.5 (B) and 8.33 SFC/ 106 PBMC (C, Wilcoxon matched pairs test).

