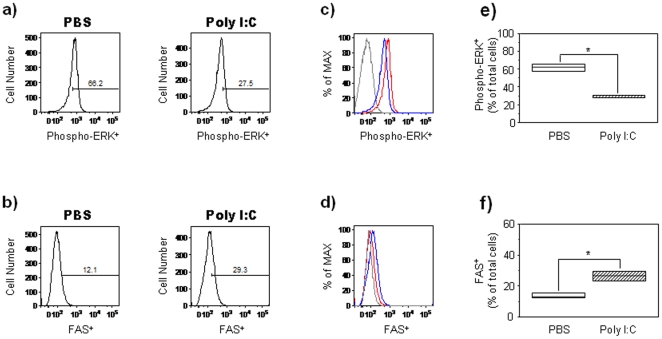
Figure 7. PIC prevents EGF/Shh–mediated ERK activation and induces Fas expression in primary cortical neurospheres.
Primary neurospheres were obtained from cerebral cortex cells isolated from WT embryos at GD14. Neurospheres were cultured for 7 days in the presence of EGF (20 ng/ml) and treated with PBS or PIC for 24 hours. (a, b) Representative histograms showing phospho-ERK and Fas-positive cells in PBS- or PIC-treated WT neurospheres. Numbers in gates represent the percentages of phospho-ERK+ and Fas+ cells. Three independent cell culture assays were performed with cells isolated from embryos (n = 12); data from one representative assay is shown. (c, d) Representative histogram showing the mean fluorescence intensity of phospho-ERK and Fas expression in PBS- and PIC-treated WT neurospheres. The mean fluorescence intensity is represented as a percentage of the maximum expression, ——, PBS-treated cells; ——, PIC-treated cells; and ——, isotype control. (e, f) Box plots showing the percentages of phospho-ERK+ and Fas+ cells in PBS- and PIC-treated neurospheres. Results are expressed as percentages of total cells (*, p<0.05 relative to PBS control group; Mann-Whitney U test). Height of box plots show interquartile range; horizontal line, median. Due to the low numbers involved in the flow cytometry experiments, the box plot upper and lower interquartile ranges also represent the maximum and minimum scores. White bars: PBS-treated mice, hatched bars: PIC-treated mice.

