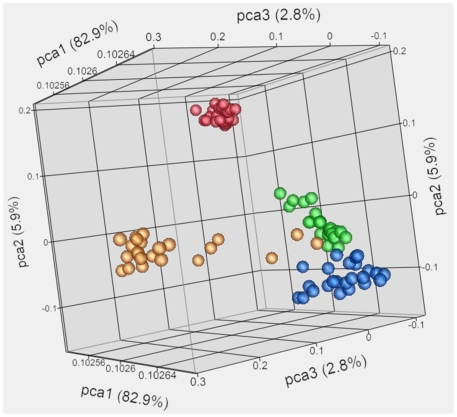
Figure 2. PCA analysis of DNA methylation levels from all monkeys eating each diet.
Four clusters can be observed, distinguished by the tissue type. The axes are based on the eigenvalues of the three principal components determined. Tissues are differentiated by color: liver, gold; muscle, blue; fat, green; and blood, red.

