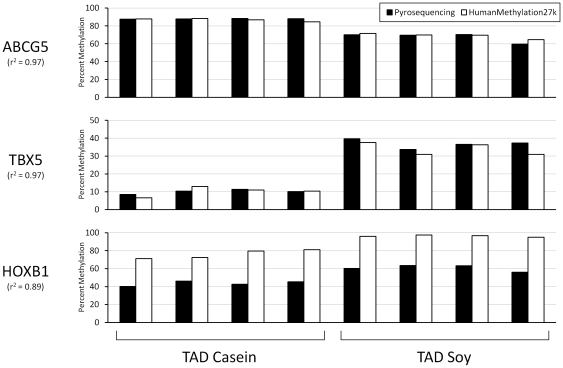
Figure 4. Comparison of HumanMethylation27 BeadChip with pyrosequencing.
The gene associated with each CpG site is shown to the left of each graph. The correlation (r2) between pyrosequencing (black bars) and the HumanMethylation27 BeadChip (white bars) is shown under each gene symbol. The four pairs of bars on the left of each graph represent the percent DNA methylation from monkeys eating the TAD Casein diet, and the four pairs on the right half represent the percent DNA methylation from monkeys eating the TAD Soy diet.

