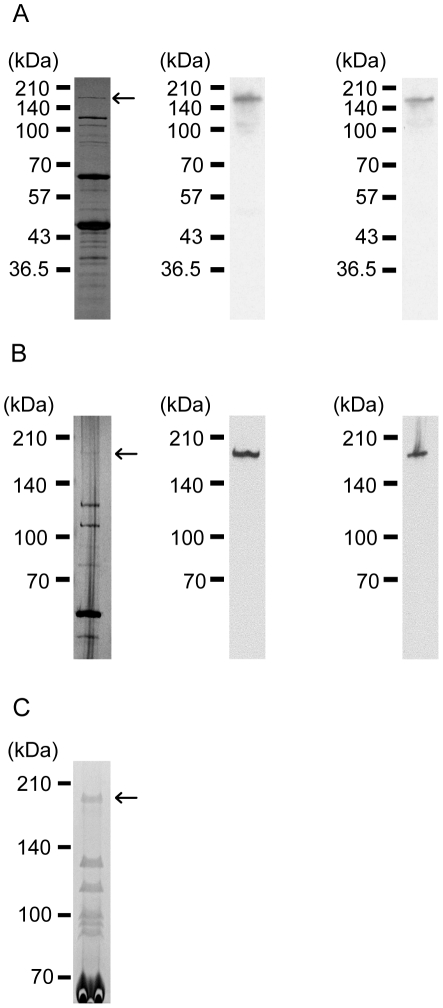
Figure 4. Structural protein analysis.
Structural protein analysis and Western blot with anti-ORF31 rabbit antisera, separated using (A) 12.5% and (B) 6% SDS-PAGE gels. SDS-PAGE images of the structural proteins visualized by silver staining are shown in the left column. The middle and right columns show the Western blot images created by anti-GP31:2640–4150 and anti-GP31:3680–5200 rabbit antisera. The arrows indicate the possible ORF31 protein band detected by the Western blot analysis. (C) SDS-PAGE image of the concentrated phage ΦEF24C proteins. Phage ΦEF24C proteins were concentrated by 100 kDa cutoff centrifugal ultrafiltration. The phage proteins were electrophoresed using a 6% SDS-PAGE gel and visualized by colloidal Coomassie G-250 staining. The arrow indicates the protein analyzed by MALDI-TOF/TOF and N-terminal sequencing (see Figures S3 and S4).

