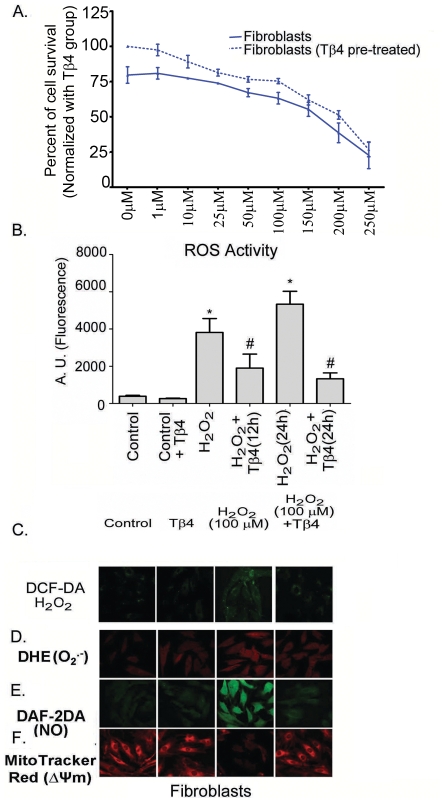
Figure 1. Effect of Tβ4 on cell viability in H2O2 treated fibroblasts.
(A) The MTT assay was performed with increasing H2O2 concentration (1 to 250 µM) in presence (dotted lines) and absence (solid lines) of Tβ4 (1 µg/mL). Data represent means±SEM of 3 individual experiments. (B) Representative confocal laser scanning microscopy images of cardiac fibroblasts stained with DCF-DA showing the effect of Tβ4 on intracellular ROS upon treatment with H2O2. (C). Effect of Tβ4 on generation of ROS in fibroblasts treated with H2O2 by fluorimetry. The graph represents the percentage of fluorescence positive fibroblasts upon staining with DCF-DA. Data represent the mean±SE of at least three separate experiments. * means p<0.05 compared to the controls and # represents p<0.05 compared to the respective H2O2 treated group (D) Representative confocal laser scanning microscopy images of cells stained with DHE Red showing the effect of Tβ4 on generation of superoxide radicals upon treatment with H2O2 in fibroblast. (E). Representative confocal laser scanning microscopy images of cells stained with DAF-2DA showing the effect of Tβ4 on generation of nitric oxide upon treatment with H2O2 in fibroblast. (F). Representative confocal laser scanning microscopy images of cells stained with Mitotracker Red showing the effect of Tβ4 on loss of mitochondrial membrane potential upon treatment with H2O2 in fibroblast.

