
Figure 3.
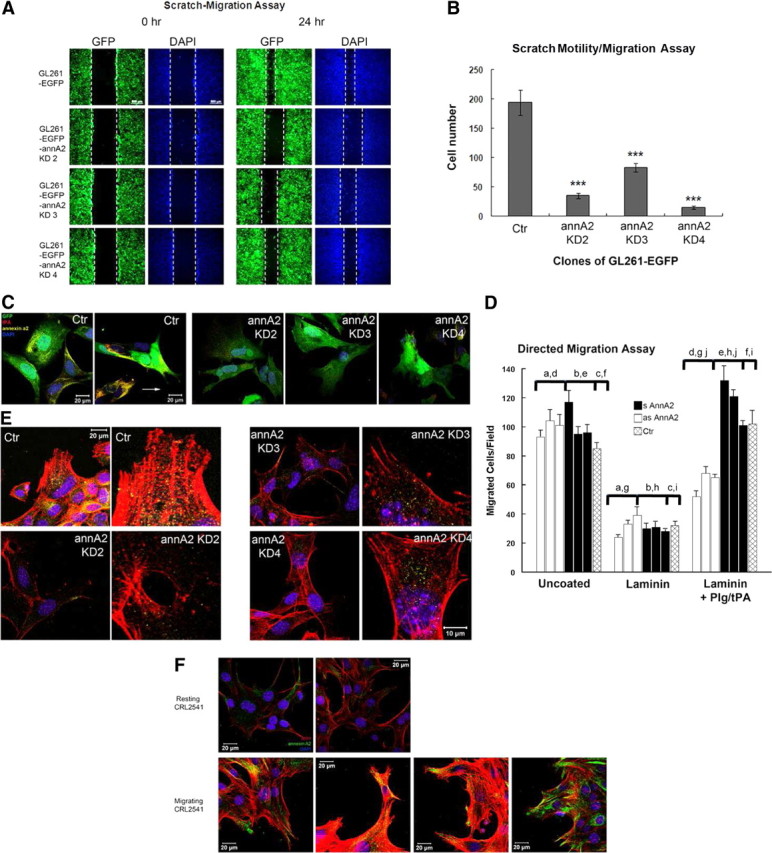
Knockdown of annexin A2 decreases glioma cell migration in culture. A scratch-migration assay was performed to evaluate cell migration. Representative images from each clone at 0 and 24 h are shown in A. White dashed lines indicate the edges of the scratch. B, Migrated cells between scratch edges in three random fields from each plate were enumerated (n = 3). C, The migrating cells were stained with antibodies against tPA and annexin A2 to examine their expression and colocalization. D, Directed migration. Three separate clones of annexin A2 antisense-transfected C6 cells (open bars), as well as annexin A2 sense-transfected C6 cells (filled bars) and nontransfected C6 cells (cross-hatched bars) were plated on laminin-coated porous filter inserts, incubated with plasminogen (100 nm) and t-PA (10 nm), and analyzed after 12 h as described in Materials and Methods. Shown are mean ± SE values for three separate experiments. Comparisons designated by a–d and g–j are all statistically significant at the p < 0.01 level. Comparisons e and f show no significant difference. GL261 cells (E) and resting or activated CRL2541 astrocytes (F) were labeled with rhodamine-conjugated phalloidin and stained with anti-annexin A2 to detect the morphology of actin filaments and the direction of migration. Blue, DAPI to visualize nuclei.