
Figure 8.
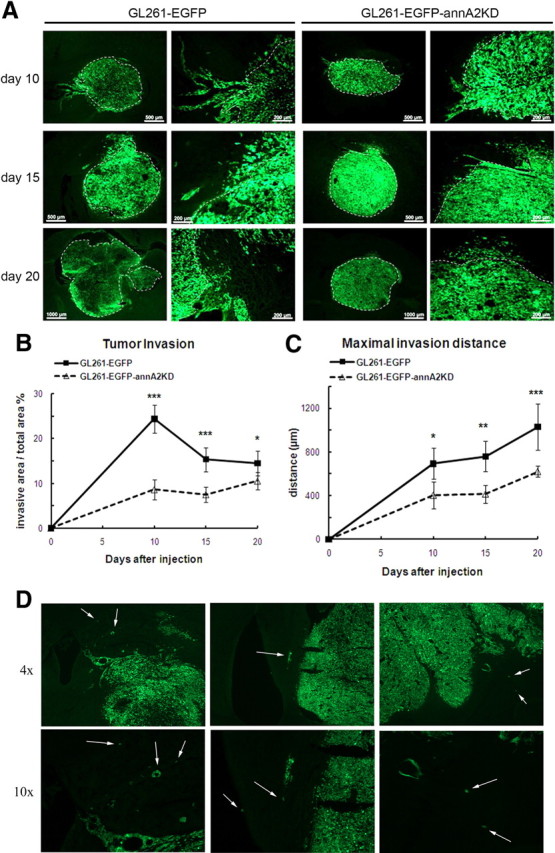
Knockdown of annexin A2 decreases glioma invasion in vivo. Tumor invasion was quantified by measuring the invasive front as a percentage of total tumor area (A, B) as well as maximal invasion distance (C) (n = 5). White dashed lines define the border between tumor mass and invasive area. D, Diffuse infiltration of glioma cells into the brain parenchyma. Arrows point to infiltrating tumor cells.