
Figure 5. FAK phosphorylation is reduced in Tg737orpk/orpk cells.
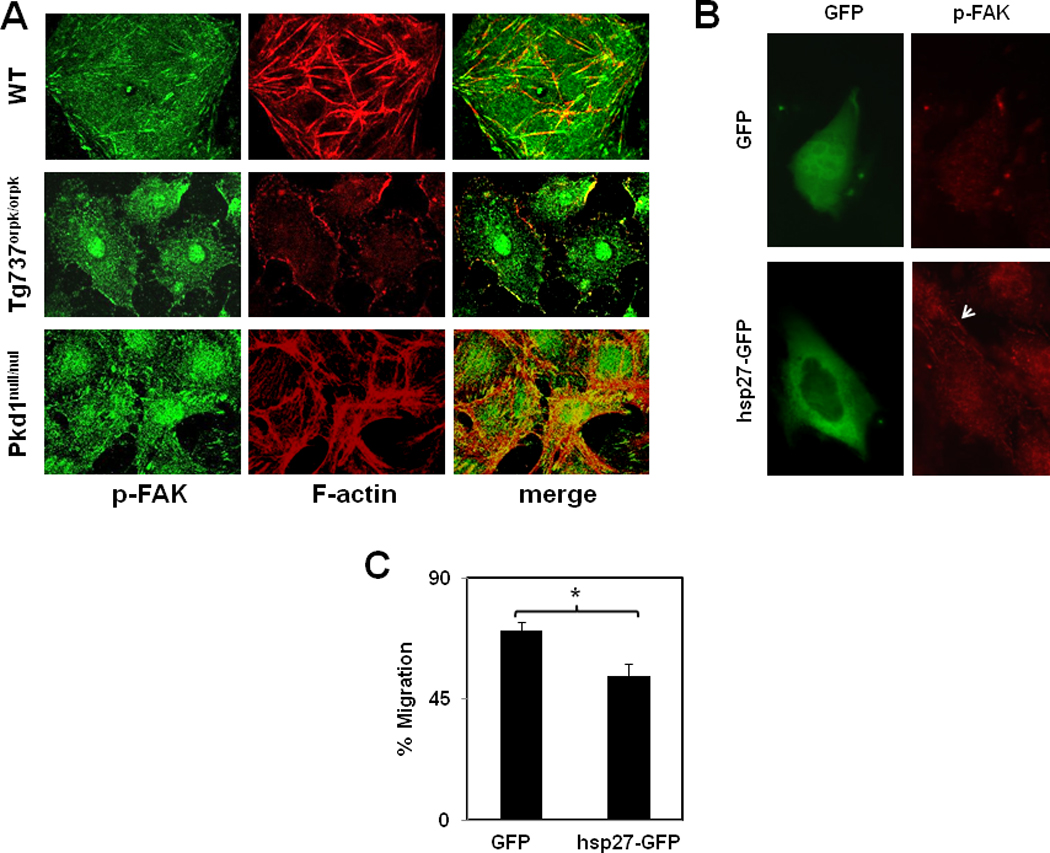
A) Confoncal fluorescence images of endothelial cells immunostained for phospho-FAK (green) and actin stress fibers (red). Colocalization of stress fibers with p-FAK (yellow) is shown in the merged images. Images shown are representative from three independent experiments. Fluorescent images showing an increase in FAK phosphorylation (B) in Tg737orpk/orpk cells transfected with hsp27-GFP compared to GFP alone. C) Quantitative analysis of the wound closure presented as % migration.