Figure 2.

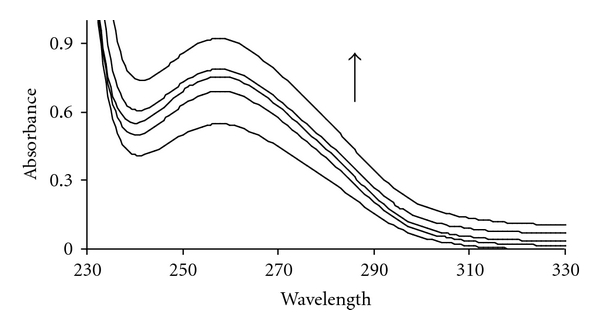
Absorption spectra of (a) DNA (5 × 10⁻⁵ M) in the absence (strong line) and presence of increasing amounts of Pt complex: r i = [Complex]/[DNA] = 0.0, 0.1, 0.3, 0.5, 0.7.

Absorption spectra of (a) DNA (5 × 10⁻⁵ M) in the absence (strong line) and presence of increasing amounts of Pt complex: r i = [Complex]/[DNA] = 0.0, 0.1, 0.3, 0.5, 0.7.