
Figure 1.
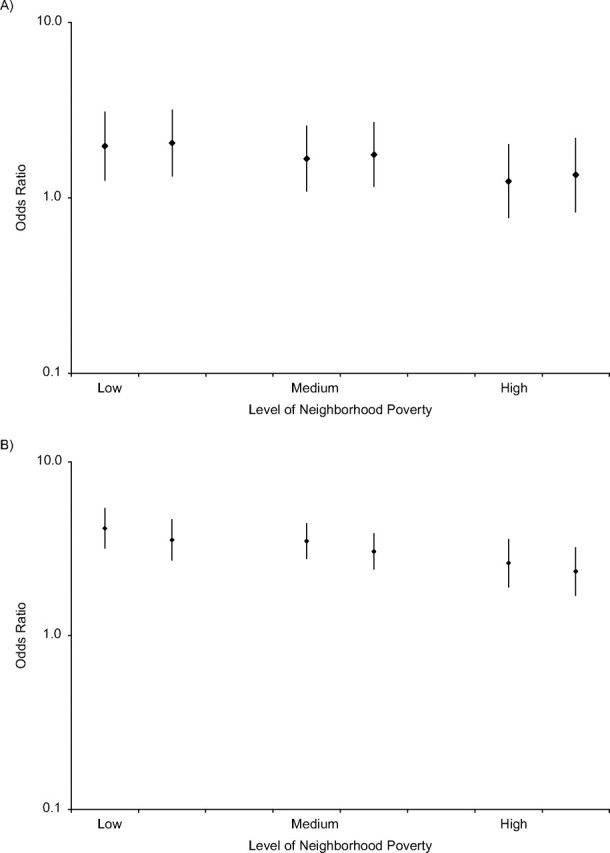
Odds ratios of hypertension prevalence in blacks versus whites by level of neighborhood poverty at low (part A; 10th percentile) and high (part B; 90th percentile) levels of segregation, National Health and Nutrition Examination Survey, 1996–2006. Each part has 3 sets of 2 odds ratios, with the left estimate of each set showing the odds ratio before adjustment for risk factors (i.e., body mass index and health behaviors) and the right estimate showing the odds ratio after adjustment for these risk factors. Odds ratios were derived from a 3-level random intercept model as described in the text. Models were adjusted for age, gender, race, education, income, black isolation score, race-black isolation score interaction, neighborhood poverty, and race-neighborhood poverty interaction. Low neighborhood poverty = 10th percentile; medium = mean; and high = 90th percentile. Bars, 95% confidence interval.